We’re in uncharted territory with COVID-19 and its impact on lives, the economy and our PPC campaigns. I don’t have a medical degree, I’m not a scientist, a first responder, or someone whose job takes them to the front-lines of the situation so I am grateful for everything they are doing.
With my skills as a PPC expert, the best I can offer is to help people get clarity so they can make the best possible decisions in uncertain situations.
At Google, one of the core tenets of innovation was to share all information. The idea is simple: if you give smart people all information relevant to a situation, they will generally all work towards the same solution to solve the problem.
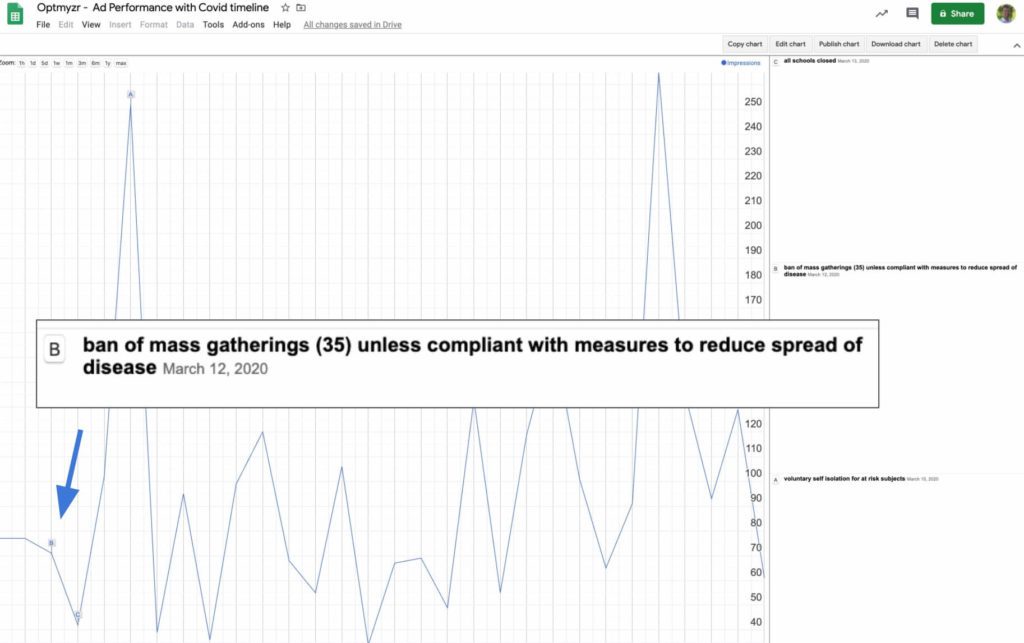
I’d like to do my part in helping advertisers get all the information in the form of a Google Ads script that overlays government actions related to the pandemic on Google Ads performance metrics.
The idea is to help you see if certain events, like store closures, the start of shelter in place, the closing of schools, or the introduction of social distancing correlates in any way with drop-offs or spikes in performance.

The time frame for which we have data for government action may be too short to see many meaningful patterns but I think the script has value because your boss or your client may ask you how COVID-19 is impacting their ads and this script can save you a couple of hours doing the work of manually compiling that data.
We’ve also heard feedback from our users at Optmyzr that this visualization has helped them because they serve customers in many locations and it’s challenging to stay on top of what is happening in all the different places where your customers may be advertising.
For this script, we are using a dataset from Kaggle with global government actions. It may not be complete or always up-to-date but it seemed like the best source for the data.
Installing the script is very simple. Just add it as a new script in your Google Ads account, add your email address to get notified when a new report is done, and schedule it to run once per day.

The script grabs geo-segmented account data for the past 30 days and adds it to a Google Sheet.

Then you can filter that data for the geo-location you want to see and the included chart will be updated automatically with just the metrics for that region and overlaid with just the government actions in that same region.

For the US, the data is most relevant at the state level. Internationally, the data is best at the country level.
Here’s the script:
The post Track how PPC performance changed when specific COVID-19 events took place appeared first on Search Engine Land.
Source: IAB

