
You’ve set up your Google Ads Performance Max campaigns for success.
Now you need insights into performance, keyword themes, where your dollars are being spent and more.
The problem?
Getting data and insights from Performance Max can be frustrating.
Here are some tips and tricks we’ve uncovered so far.
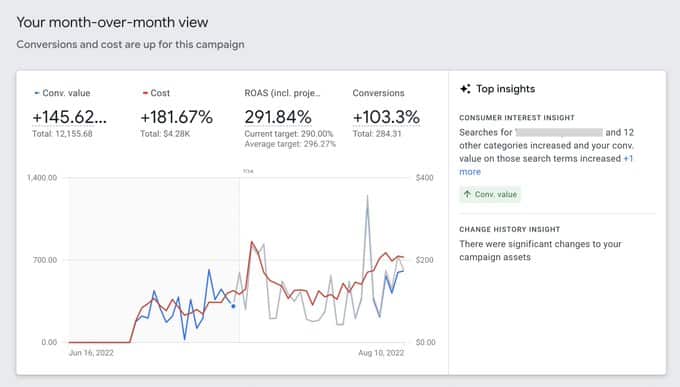
Insights: Performance trends
While more granular data is limited, take advantage of the Insights tab.
There is some useful info on overall trends.
You can view week-over-week or month-over-month data.
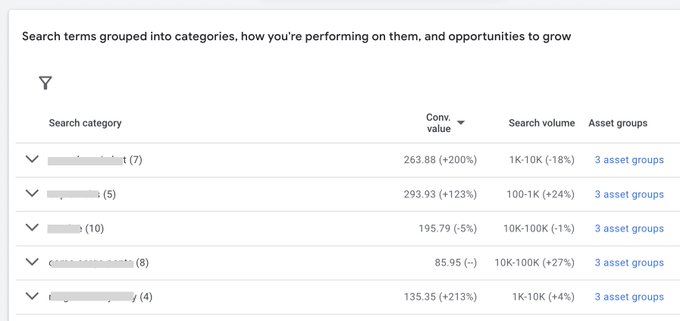
Insights: Keyword themes
Additionally, while you cannot see actual search terms, you can see keyword themes as well as basic performance data.
Listing groups vs display: Where are your dollars being spent?
Compare overall campaign spend in the Campaigns tab vs. overall spend of all Listing Groups
This will help you understand the spend breakdown between Video/Display and ad units created with the datafeed.
Note: If you find that Display/Video traffic is not converting as well as your datafeed, you can turn off URL expansion in the campaign settings.
You can also try running a Smart Shopping style Performance Max campaign:
For eCommerce: Something worth testing for Google Shopping, especially if you've seen success with Smart Shopping historically: Launch a pMax campaign with no assets aside from the datafeed.
Note: You'll likely need to create a new Asset Group. https://t.co/4EUj1KQuwx
— 𝙼𝚎𝚗𝚊𝚌𝚑𝚎𝚖 𝙰𝚗𝚒
Google Ads
(@MenachemAni) July 21, 2022
Segment: Your data
In the campaigns tab, you can filter by campaign and segment by:
- Device
- Day/Time

Landing pages: What pages are getting traffic/conversions?
Note: This report is not available within a Performance Max campaign, you’ll need to access it from the All Campaigns tab and filter your PMax campaigns only.
All Campaigns > Landing Pages > Filter by Campaign

Locations: Where is the traffic and sales coming from?
In the Locations tab, you can drill down performance by:

Reports: Use custom reports to roll up your data
Go to the reports tab and build a custom table showcasing performance by:
- Placements (Display/Video/Datafeed)
- Brand (Datafeed)
- Category/Collection (Datafeed)
- Custom Labels (Datafeed)

Note: Placements can be excluded on the account level:
So, I have to post a retraction of yesterday's snarky TikTok video. There IS a way to see AND exclude placements for Performance Max campaigns.
I wrote up how to do this here, and also wrote this really complex apology-song to Google
#performancemax #ppcchat
— Kirk Williams (Out of Office) (@PPCKirk) August 3, 2022
The post How to maximize insights from Performance Max appeared first on Search Engine Land.
Source: Search Engine Land