If you’ve been running Google Ads for any amount of time, you’re probably aware that there’s generally a competitive aspect to any campaign that makes you want to monitor your vanity metrics around where you rank.
In one of my former jobs, a senior leader would walk by every day and ask who ranked number one that day, us or the competition.
The question wasn’t are we lowering our cost per acquisition or improving the overall metrics of the account, it was pure vanity and the desire to “win.”
While “winning” in this way isn’t actually meaningful, it is important to pick your head up out of the sand from time to time and understand how your campaigns are performing vs. the competition. This helps you know who your actual competition is and how aggressive they are.
These data points can be used to understand fluctuations in your own data. If your click-through rate is down, but you really haven’t changed anything, that doesn’t mean your competition isn’t on the move. Google recognized the importance of these data points and has been rolling out more competitive metrics into the Google Ads platform.
In the reporting section of Google Ads, you will find these metrics under “Competitive Metrics” and “Auction Insights” from the metrics and dimensions menu list. Underneath these two areas are some really great tools for understanding how you stack up to your competition. Here are a few of my favorites.
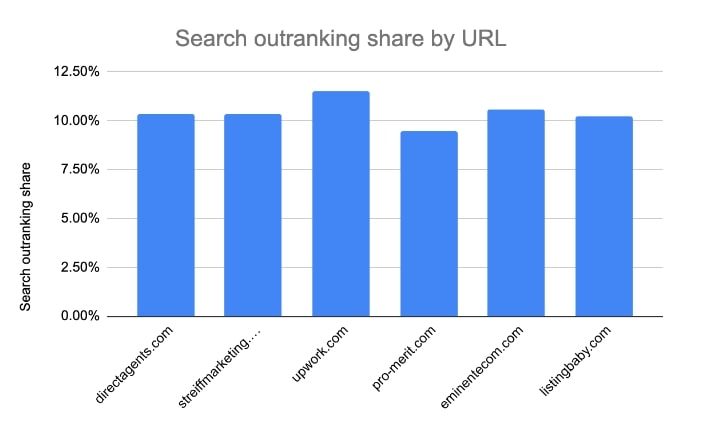
Search Outranking Share
This data will let you know what specific domains are outranking your ads and how often. You can use this data at all levels (account, campaign, ad group, and keyword).
We find this particularly helpful when there is a direct brand selling with various affiliates. Since seeing all the various competitors is difficult given a host of factors, it can also be helpful to understand and identify competitors that were not on your radar.

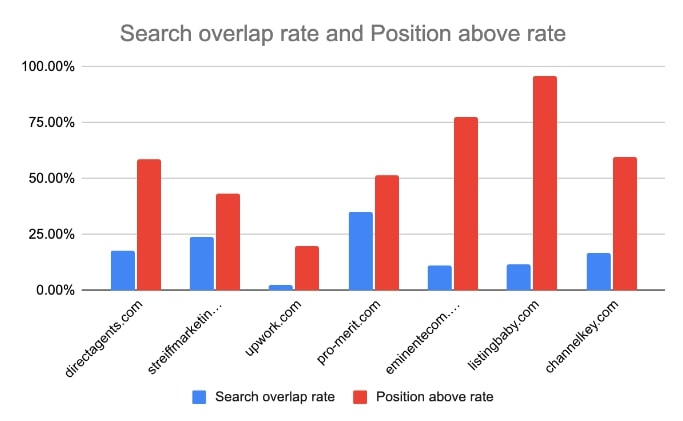
Search Overlap Rate and Position Above Rate
A couple of other similar, but important metrics available are Search Overlap Rate and Position Above Rate.
Search Overlap Rate helps you understand how often a brand or domain also appears with you. This will give you a better understanding of the options your consumers have on the search results page.
The Position Above Rate metric provides insights into how often that brands ad appears above your own ad when they are both shown together. The last part is really important.
The data is not just telling you how often that brands ad has a higher rank than your average rank, but specifically when you are bidding against one another for the same customer search result.
Why is this important?
Because it helps give some insight into direct competition.
In the below data Listingbaby.com outranks the clients ads almost 90% of the time.
The action I would take based on this would be to understand their ad copy and landing page experience to evaluate the search experience. Looking for potential variances that would impact quality score.

Under the competitive metrics there are also a lot of valuable data points. The data points we use the most are around Impression Share.
Understanding impression share helps give your brand insight into the total market opportunity.
Impression share is the percentage of total impressions that your ad was displayed vs. what was possible.
For example, if there are 100 searches for “running shoes” and your ad showed for 50 of those your impression share would be 50%.
The next piece that Google provides insight into is why your ad did not show for the other potential search results. They break it down into two buckets:
- Lost due to Rank
- Lost due to Budget.
These are really the two key levers to your ad being shown more. We use this all the time to help customers understand, “How high is up?” “What is the total market opportunity?” “How much could we spend if we exceed our ROI targets?”
For your keyword strategy the exact match impression share metric can help you understand how well aligned your keywords are to what consumers are searching for.
Having exact match keywords will give you a better ability to control bids and the entire experience. It’s certainly not possible to have this be 100%, but monitoring this metric gives you a sense of how closely aligned you are and when your customers might be altering what they search for or how Google is changing the algorithm.
Click share is another important competitive metric that is provided. “Click share” is the clicks you’ve received on the Search Network divided by the estimated maximum number of clicks that you could have received.

These impression share metrics are available for both display and search campaigns.
They are also available for absolute top impressions (true #1 ranking). Reminder, it is a vanity trap to just chase the absolute number one position, unless you are crushing your KPIs, then it’s game on.
These metrics can be used in the following various areas of your business.
- Search marketing: Inform bid and keyword strategies
- Product Management: Understanding more about who the true competitive set is and how they position their products (we find too often brands ignore who their true competitors are and focus on perceived competitors).
- Creative/UX: Can look at the competitors and their landing page experiences.
- Finance: To understand and forecast the market opportunity. Helping to inform budgets for upcoming fiscal planning.
These data points put campaigns into context
These data points help advertisers understand what volume is available and who you competing against.
Using this data can help inform a variety of business units beyond just search marketing.
Use the data wisely, keep your ego in check and go out and win!
The post How to use Google Ads Competitive Metrics appeared first on Search Engine Land.
Source: Search Engine Land

