Skip to content
  • Texas | Arizona | Virginia | Idaho | Illinois
  • (888) 705-0930
  • info@therawragency.com
Facebook-f Twitter Instagram Linkedin-in
rawr logo short
  • Home
  • About
  • Solutions
    colorized icons 04
    B2B Marketing
    colorized icons 05
    B2C Marketing
    colorized icons 06
    Online Visibility Management
  • Industries
    colorized icons 07
    Healthcare
    colorized icons 08
    Manufacturing
    colorized icons 10
    Home Services
    colorized icons 09
    Professional Services (B2B)
    colorized icons 11
    Retail
  • Services
    colorized icons 01
    Brand Strategy
    • Graphic Design
    • Corporate Brand Identity
    • Sales Enablement
    • Editorial Calendar Management
    colorized icons 02
    Website Design
    • WordPress Website Development
    • Conversion Rate Optimization
    • eCommerce Development
    • Content Strategy & Copywriting
    colorized icons 03
    Digital Marketing
    • Digital Marketing Strategy
    • Search Engine Optimization (SEO)
    • Pay-Per-Click (PPC) Management
    • Content Marketing & Digital PR
    • Account Based Marketing (B2B)
    • Marketing Automation
    • Social Media Management
  • Blog
  • Contact
Let's Talk

Google releases Data Studio Dashboard for Web Stories

google analytics events web stories 800x485 1
  • February 16, 2022
  • Uncategorized
  • Agency
Facebook
Twitter
LinkedIn
Email

Google has created a Data Studio sample template called the Web Stories Insights Dashboard. It provides an overview of how your Google Web Stories are performing. 

Web Stories are visual, tappable full-screen mobile stories that can be found via Google Search and Discover.

Metrics you can view in Web Stories Insights Dashboard. There are two main tabs: Overview and Story Level. Among the metrics you can view on this dashboard:

  • Key Metrics: Story starts, page views, time spent and completion rate (number of story completions divided by story starts).
  • Audience Metrics: Age, gender and device.
  • Top Stories: Your top 10 stories during a selected time period, sorted by Story Starts.
  • Traffic Channels: An overview of how users have found and read your Web Stories – organic search, direct (which includes Discover), referral, social, email, or custom.
  • Story Level Performance: Key metrics and a breakdown of pageviews for a specific story.

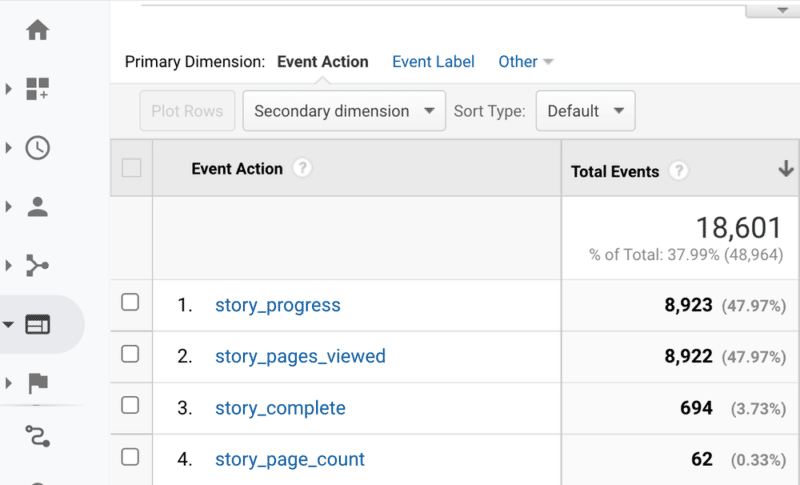
For this template to work, you’ll first need to set up tracking for your Web Stories in Google Analytics (or another analytics provider). For whatever editor you use to create Web Stories, you’ll need to provide your UA Tracking ID. After you’ve done this, you can view performance metrics by navigating to Behavior > Events > Overview.

Then you’ll be able to see metrics including story starts, time spent, story pages viewed and story completions:

What the Web Stories Insights Dashboard looks like. This:
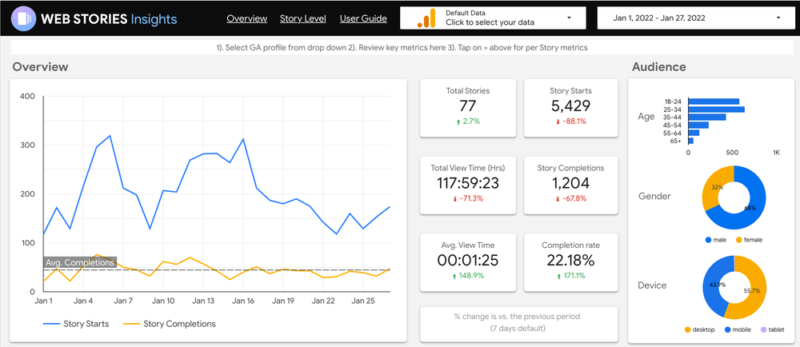
Web Stories Insights Dashboard, created in Google Data Studio

How to get the dashboard. You can access the dashboard here.

Once you get there, simply select your analytics account from the dropdown to see your data. Also, you can copy the template and customize it to your liking. 

For more information, you can check out this blog post. Google also shared a video that walks you through setting up and using the dashboard. 

Why we care. Data is king. This template provides a visual overview to help determine how well your Google Web Stories are performing. You can see how engaging your content is and how people are finding your stories. Tracking the performance of any content you’re investing time and resources into is essential. 

The post Google releases Data Studio Dashboard for Web Stories appeared first on Search Engine Land.

Source: Search Engine Land

Facebook
Twitter
LinkedIn
Email

Recent Blog Posts

9 Hidden Revenue Blockers Every CRO Needs to Eliminate

February 3, 2025

What Is B2B Appointment Setting?

November 29, 2024

Leveraging LinkedIn for Targeted Growth

November 12, 2024

Mastering B2B Prospecting: Key Strategies for Sales Success

November 4, 2024

Maximize Marketing ROI: How Cost per Lead Can Fuel Your Business Growth

June 13, 2024
View More
rawr logo short
Facebook-f Twitter Instagram Linkedin-in
Get In Touch
  • Texas | Arizona | Virginia | Idaho | Illinois
  • (888) 705-0930
  • info@therawragency.com
Send An Email

"*" indicates required fields

Copyright 2025 | The RAWR Agency, LLC. |

Sitemap | Privacy Policy

We use cookies to ensure that we give you the best experience on our website. If you continue to use this site we will assume that you are happy with it.OkNo