
As an SEO I’m constantly utilizing keyword search volume data to help make more informed decisions about clients’ online presence. But the reality is, this data has way more use cases than anyone gives it credit for. The role of a decision maker in any online business requires the ability to gather (or be presented with), understand, and forecast with all types of data. Simple yet effective methods for identifying trends in online searches can ensure you’re getting your product or services in front of the right people at the right time. This is particularly useful if you sell a variety of seasonal products online. But the same process can be leveraged for single-focus businesses, as well. This data can then trickle down to a variety of team members, from SEO and Paid Search Account Managers, to merchandisers and content strategists. How you ask? Let’s look at some use cases:
- As a Paid Search Manager, I want to utilize trend data to help inform when to ramp up ad spend on certain product categories.
- As an SEO strategist, I know it can take months to see the impacts of my work. So, knowing when my customers are searching most frequently will help me to prioritize my focus leading into peak season.
- As an ecommerce merchandiser, I want to understand how interest in our products have shifted over time. I want to be able to identify new trends gaining popularity so I can make more informed buying decisions.
- As a content strategist, I want to ensure we are providing our customers the most appropriate user experience based on peak search times for our products. How and when should the site be updated to speak to these seasonal trends?
And most importantly, as a business owner/key stakeholder:
- I want to be able to challenge my own assumptions (LOL) about my customers’ needs
- I want to know if my products are still in demand
- I want to know if there is a segment where I could expand my business
- I want to know if there are tangential lines of business that have some growth opportunity
I could continue, but the point I’m trying to drive home is decision makers in their respective silos are generally unaware of the true value in the data Google really shares. And thus, it’s your job to collect and disperse this knowledge across your organization. Break down those silos, friends.
So, you’re ready to make a name for yourself in your organization. Great. The best part is, it’s super easy to collect this data and analyze. I’m going to show you how to do it.
The tools
I’ll be leveraging a few different tools to capture the data I’m looking for. Specifically:
- SEMRush for keyword research
- Google Keyword Planner to pull the historical keyword volume data
- Microsoft Excel to bring all that sweet, sweet data to life
Now, you could make the argument that Keyword Planner is unnecessary, as SEMrush provides keyword trend data. However, the data is limited (past year only) and it’s formatted and exported in a rather complicated way that I’m not a huge fan of. Google Keyword Planner has its own which I’ll address a little later on. Remember, we’re using this data directionally, not as the end all be all.
The steps
First off, we need to start pulling together a list of relevant keywords for your brand. Depending on the size of your site and the products/services you offer, this could be a very large list, or a very small list. If I’m looking at an enterprise size ecommerce site, I like to approach this in bite size pieces rather than tackling the entire site at the same time. Focus on your priority categories and go from there. Remember, we’re trying to make our list comprehensive because we want to get the most out of our data. For this task I rely heavily on SEMrush’s Keyword Magic Tool. The tool makes it super easy to insert a “head term” and get back a ton of useful and related keywords.

As I mentioned previously, you want to conduct your keyword research in a way that’s relevant to your site’s taxonomy. Segmenting this data now will make your life a lot easier later when you’re trying to identify trends based on categories. Fortunately, the Keyword Magic Tool makes it easy to segment keywords by specific word groupings, and they’ll neatly categorize these for you in your export.


On the historical metrics tab, you can adjust your settings to include specific countries of interest, as well as languages. Most importantly, you’ll want to adjust your timeframe to include a longer period of time, since you know, we’re looking at trends.

Next you’ll hit Export and select the Download Option “Plan historical metrics (.csv). This will ensure the data you receive is trended by month, which is exactly what you want!

Remember when I said that Google Keyword Planner has it’s own inefficiencies? Here’s a few things to keep in mind:
- When reviewing Historical Metrics, Keyword Planner likes to consolidate similar keywords (example: wedding dress and wedding dresses). So you might find that your lengthy keyword list just got cut in half. That’s okay – you can either utilize what you have or try to build out your list further.
- Keyword Planner also likes to modify keywords. So a keyword in your original list might have been modified by the tool (example: “women’s shoes” might be changed to “shoes for women”).
- When you export you’ll get a bunch of data you don’t care about, so you’ll have to clean the sheet up a bit. I typically only leave the Keyword and the Keyword Volume Trend columns intact.
Next, you’re going to combine your SEMrush sheet and your Google Keyword Planner export into a single Excel file. On your Keyword Planner tab you’re going to add a Group column and add a VLOOKUP so that you call pull the keyword grouping over from your SEMrush sheet. This way all your keywords are categorized based on the groupings that align with your site categories. If you don’t know how to do a VLOOKUP, look it up because it will change your life. Once everything is combined, your master sheet will look like this:

Let’s bring all that beautiful data to life. We’re going to do this through Conditional Formatting in Excel. There are a couple of steps to get the trend visualized.
Step 1: Highlight a single row of one year’s data. In the example below, that’s January 2017 – December 2017. Then go to Conditional Formatting < Color Scales < Green – Yellow – Red Color Scale. This will make the smallest number in the range red, the largest number green, and anything in between a blend.

Step 2: Once you have this done, you’ll have to apply the formatting to each row of data within the same year. Highlight your range and click Format Painter. Then apply that Conditional Formatting to each row within the same year. Tip: once you have a few rows completed, you can bulk Format a larger section, so you don’t have to go row by row. See below on how to do it:
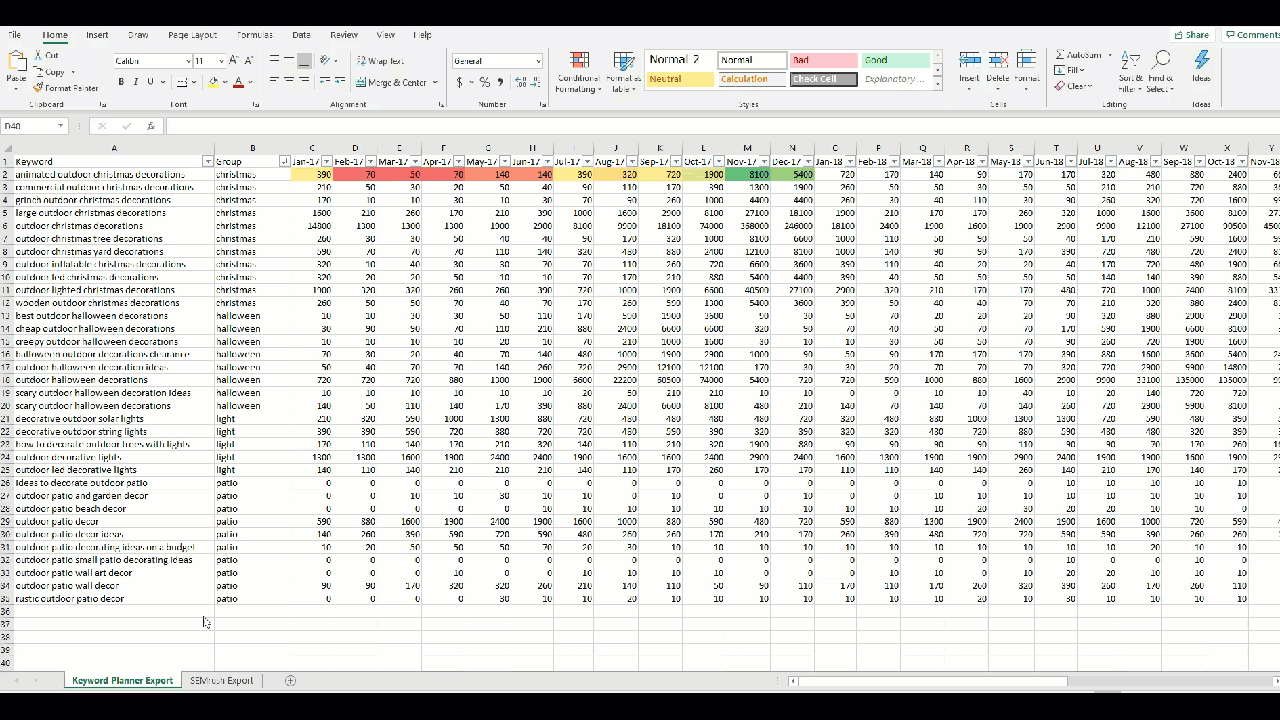
Step 3: Implement the same conditional formatting for each year within your Excel so that you see the high and low values for each year individually.

VOILA! Your search volume trend chart is complete. Really makes you want some Fruit Stripe gum, doesn’t it? Now you can review the data by category to answer some of those pressing questions you might have:
- Are your seasonal assumptions about your business valid? Have those search trends changed over time?
- Has a category gained/lost interest over time? Does this data help to validate some of the increases/decreases in your KPIs?
- Do seasonal trends start to ramp up sooner than expected? How can you leverage different marketing channels to prime customers for peak seasonality?
- Is your business even impacted by seasonality online?
There is a bounty of useful data available to help you make better decisions about your online marketing. These trend charts are just one small step towards my efficient marketing.
The post How search data can inform larger online business decisions appeared first on Search Engine Land.
Source: IAB