Google Ads is testing “Explanations” in the interface to help advertisers diagnose potential reasons behind changes in conversion volume.
Announced this week, Explanations are available at the campaign and ad group levels when there is a significant change in performance of clicks, cost, impressions or conversions.
Before you read further, if you’re all in on Smart bidding, you won’t see Explanations. They’re only available — at this point — for Search campaigns using manual bidding or enhanced CPC.
How it works. To see Explanations, you’ll need to compare contiguous time periods of the same length — 7 days vs. the previous period, for example — and have sufficient volume activity.
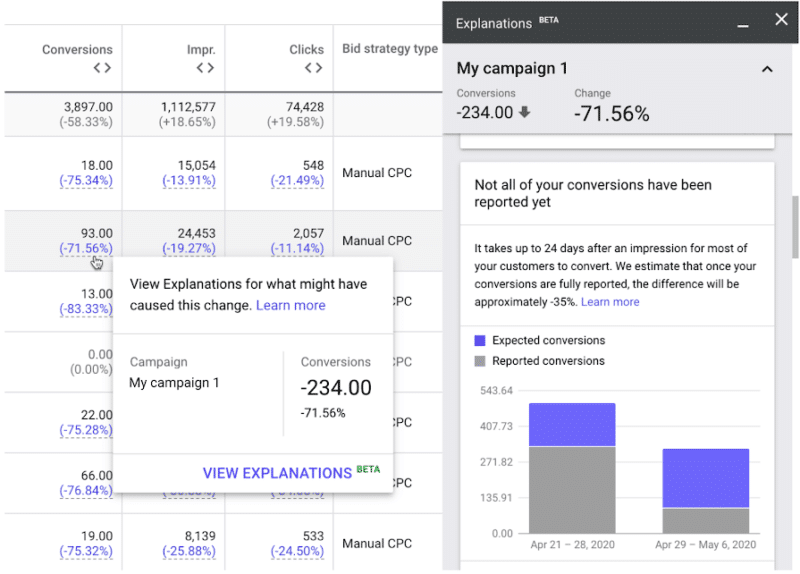
You’ll know an Explanation is available if the percent change in a column is blue, as you can see in the screenshot example above. If the percentage change is gray, that means an Explanation isn’t available. Explanations are also only available for the past 90 days.
When you hover over a blue percentage change, you’ll see the option to View Explanations. Once you click on the window, Google Ads starts process the Explanations report, looking for a number of common reasons. The report displays on the right side of your screen.
Here’s the list of things the tool checks:
- Search interest
- Auction activity
- Status changes
- Campaign settings
- Budget
- Bid adjustments
- Negative keywords
- Targeting changes
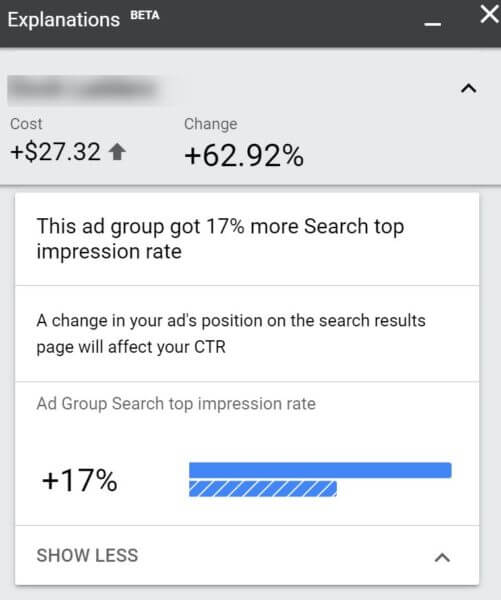
What you’ll see. If you run Explanations at the campaign level, Google will also highlight potential reasons for change at the ad group and keyword levels in the report. For example, below is an explanation about Search top impression rate changes in an ad group

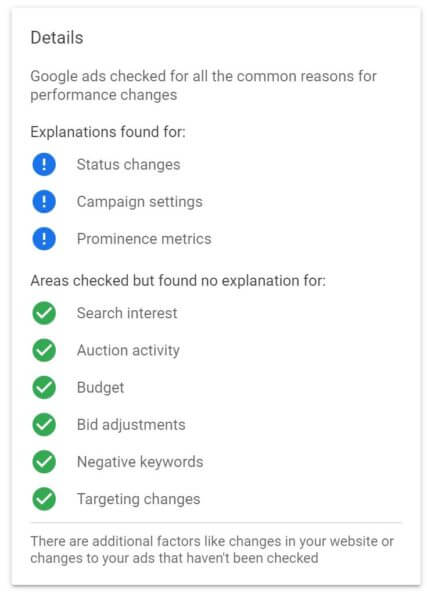
At the bottom of the report, you’ll see a checklist of what Google scans for and what it did and didn’t find explanations for. Note the mention at the bottom that Google does not scan changes on your websites or to your ads as possible factors affecting performance.

Why we care. If you’re running Search campaigns with manual or eCPC bidding, this could be a helpful diagnostic tool. If you’re newer to working in paid search, the tool also offers a helpful rundown to help you understand the levers that can affect performance and to understand the impact of shifts in metrics like top impression rate.
You’ll also want to reference the Change History report to see if there were changes to ads as well as understand if there were changes made to the site (your company might use Annotations in Google Analytics, for example, to track these) that may also have had an effect on performance.
The post How to use Google Ads Explanations to understand performance changes appeared first on Search Engine Land.
Source: IAB
